Journey Map (May 2018)
Scenario: Quick Reports
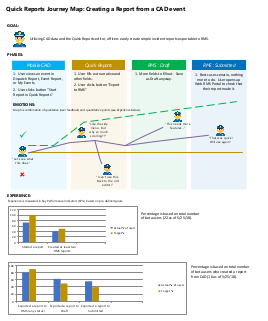
Quick Reports (Beta) was a South Sound 911 application geared towards more automated police report writing. It utilized CAD (computer-aided dispatch) data from the 911 call to create a police report in the RMS (records management system).
This application was released to a focus group for a trial period. As a side project, I thought it would be helpful to create a journey map of the focus group's experiences.
Goals
Illustrate users' experience with Quick Reports; demonstrate journey mapping to project managers as a tool we could use in the future.
Process
This was my first attempt at a journey map, so I wanted to start simple. I queried our databases for some basic statistics about the police reports which had originated in Quick Reports and stacked them against what I thought were reasonable objectives*. For the qualitative feedback, I reviewed notes from the focus group, as well as notes from my field user testing with a police officer. With this data, I used Visio and JoyPixels 4.5 (license) to illustrate the situation in the journey map.
*Objectives are noted as pre-defined for the purpose of showing the project manager how we would go about it in the future.
Outcome
While Quick Reports was ultimately shelved, I personally found the journey map to be a great visual tool and, with more data, would use it again on future projects.